Sunday, November 6, 2011

Meteorological and sea surface data

Peter here to talk a bit about the meteorological and sea surface data that we get on a daily or more frequent basis that helps us make decisions and plan our scientific activities. The L.M. Gould has several real-time displays of the air and sea surface water properties along with navigation information. The Data Acquisition System (DAS) provides this information. The information is displayed on monitors in the labs and other public spaces on the ship (see Fig. 1) and also on the ship’s intranet website. A recent display shows, for example, that the wind speed from both the port and starboard anemometers was about 16 kts out of the northeast, the air temperature was about 1 degree C (33 degrees F), and the sea surface temperature was -0.9 C.

Fig 1.
When this image was taken on the morning of Nov. 6th, the Gould was sitting close to the Cape Shirreff camp site on Livingston Island, waiting for the fog to lift so that the setup of the camp for the summer season could begin.  Much higher winds and seas on Nov. 5th prevented the movement of gear, food, and other supplies to be ferried by zodiac boat from the Gould to the shore at the foot of the camp. With the winds in a safe working range and the seas diminishing, what was needed was for the camp to be visible from the ship, but fog hampered the start of the operation. The navigation information on the DAS display provided the ship’s position (latitude and longitude), speed, course, yearday, and time.

Fig. 2.
Also available on the website are isobar images of sea level pressure (millibars), sea ice images, wind charts, wave height charts, and weather forecasts. The wind charts are especially useful because they provide not only the current status, but also forecasts for 24 or 48 hrs ahead of the current day. See the chart (Fig. 2) showing the region from the southern part of South America on the right to the Western Antarctic Peninsula on the left. The red dot just north of Livingston Island marks the location of the Gould. This chart is a 24 hr forecast for the wind strength and direction for Nov. 7th.  The bars on the stick flags provide a measure of wind speed. One full flag bar is 10 kts and a half-bar is 5 kts. Thus 2 ½ is 25 kts.  Wind direction is indicated by the stick with flow towards the stick base away from the flag.  While working conditions were good on Nov. 6th, with winds around 15 kts, on Nov. 7th the winds will be much stronger (around 30 kts) and blowing from west to east at Cape Shirreff. 

Once the camp at Cape Sherriff is setup, the Gould will begin the trek to Palmer Station to offload more gear, supplies, and people. On the way, we will do a first station where we will take an IKMT trawl sample, do a CTD cast, and take a MOCNESS tow. We will use the wind chart above to help us determine which of the station locations we have chosen to sample at to do first. It will have to be protected from the high winds and seas.

-- Peter Wiebe (Woods Hole Oceanographic Institution)

Bonus Post

Joe Warren is a professor of Marine Sciences at Stony Brook University; he is the lead investigator for a different NSF-funded project on our cruise, LMG11-10.  You can follow Joe’s blog at: http://aleslab.blogspot.com/.  Here are the extra-credit questions Joe has posed for his SBU Physical Oceanography students.  -- Ann Bucklin

On the boat we get a couple different kinds of weather and satellite maps which we use to help us try to understand what the weather will be like during our trip. We also get a daily forecast sent to us for the general area by the Navy which is very handy and supplements the following maps.

Ice Coverage
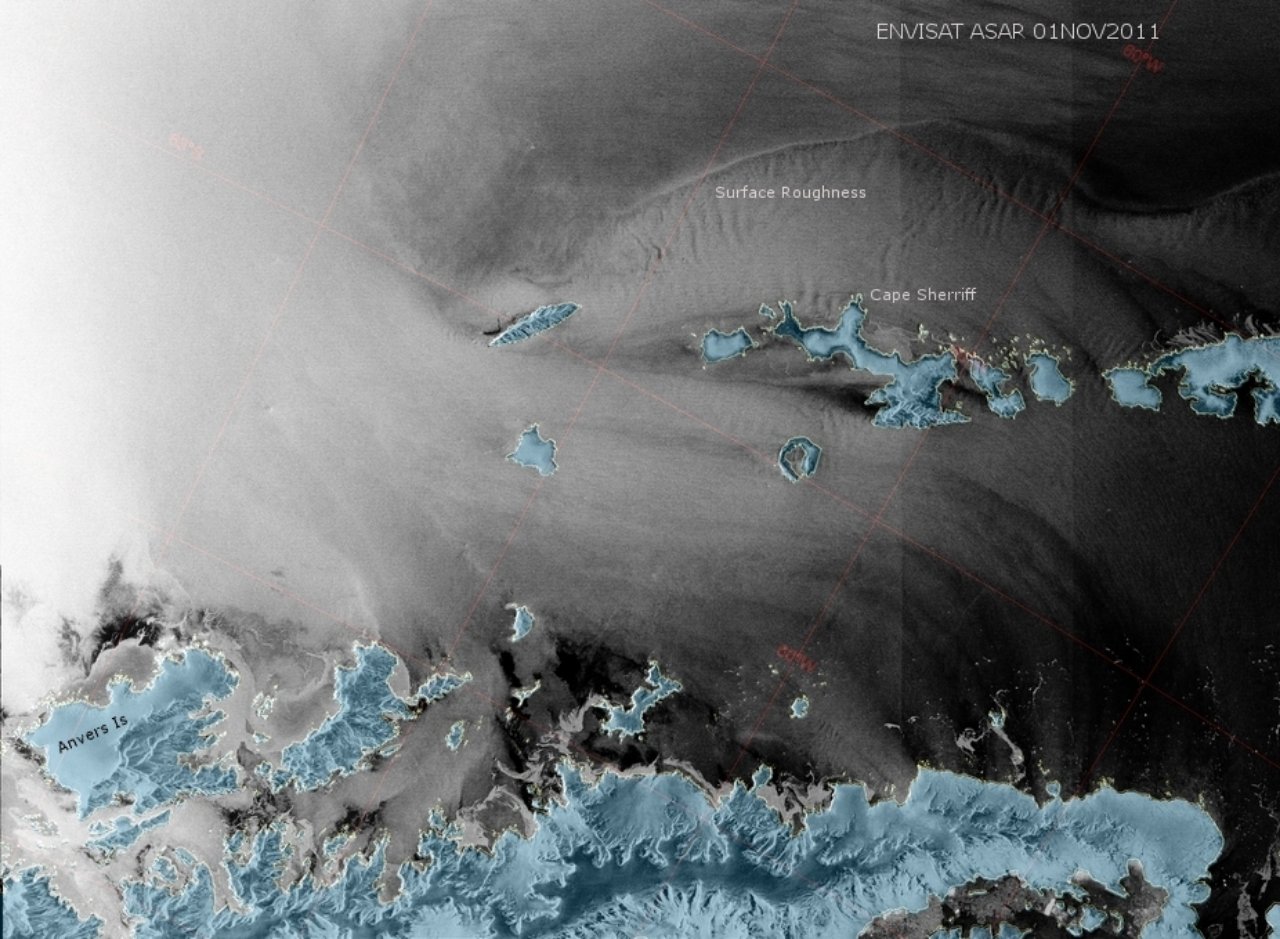
Satellite image of ice cover from 01 Nov 2011 
Satellite maps of ice coverage are useful for us to determine how likely we will be to open the field camp and drop off the penguin and pinniped researchers.  Land masses are filled in blue. Ice coverage can be seen, although in some cases it is difficult to determine ice vs. cloud cover vs. other reflectances in the images. Icebergs appear as small white dots or specks. There are many different stages of ice (brash, grease, frazil, pancake, fast, first year, second year, etc), and these images often can't distinguish these types from one another. Our last night in Punta Arenas, we ate dinner next to a group of pilots from NASA who are flying radar and other instrumentation aerial surveys of ice cover and thickness on Antarctica (mostly ice on land, not sea ice). Their instruments can measure ice thickness, heat content, or other data types that help us to understand the movement of heat in this region.

Barometric Pressure Maps
Combination visible satellite and barometric pressure map (green lines) for today
The Chilean Navy's maps relay on hand drawn isobars and contours. You can see from the map, they welcome reports of current conditions to help their forecasts as there are very few weather stations in this area to provide input data into predictive models.
Underway Meteorological Observations
The ship has monitors in most labs (and state rooms) that display the current meteorological conditions. This (as well as deck cameras) is very useful information to have when getting ready for deck work on the ship as you have some idea of what it's like outside before you actually go outside. I've blacked out the wind speed and direction information in this image, but you can look at what the current air and sea surface temperatures are right now.

Questions for students

1. What is your prediction (based on the satellite image above) for the level and type of ice we'll encounter tomorrow when we get to the camp. We will be anchoring the boat NE of the Cape Shireff peninsula about 1.5 km from land. Provide an estimate of % of surface covered by ice and thickness (in cm) of the ice that we might find (guessing open water / no ice is also an option).

2. What would the presence of a 10 cm thick layer of ice over the surface of the water around this island mean in terms of the temperature and salinity profiles here ?  That is, draw T and S vertical profiles for a spot just off of Cape Shireff (assume water depth is 200 m) for early austral spring (November) for the region with and without a layer of ice.

3. Our ship is currently located at 59.5 S and 62.5 W.  Using the two above maps (and no other resources), provide a prediction of the following for today: wind direction (remember we're in the southern hemisphere) and rough guess at the speed and % cloud cover. And for tomorrow (05 Nov – noon – you can assume all times on the maps and for predictions are GMT), predict what the wind speed (qualitatively) and direction will be at Cape Shireff (roughly located at 62 S, 62 W). Provide an explanation for what your predictions are.

4. From the meteorological plot, do you think we are on the North or South side of the polar front (i.e. Antarctic Circumpolar Current) ?  Provide an explanation of why you picked which side.

Answers will be posted in due time both here and on the Warren Lab home page.  See http://aleslab.blogspot.com/


Posted by Joseph D. Warren (Stony Brook University)

Saturday, November 5, 2011

Launching the XBT


This morning started at 6am since I volunteer for the XBT/XCTD/water watch from 6-9am with Julie Jackson and Joe Warren. The XBT stands for Expendable Bathy Thermograph and XCTD is an Expendable Conductivity-Temperature-Depth probe. Both are missile-like probes that have heavy tips and are launched with a black device that looks like a gun, so we couldn’t resist taking some cool looking pictures.

Both the XBT and XCTD are connected by a thin copper wire to a computer on board, so when we launch them they collect data on the temperature and salinity of the ocean continuously through the water column.  The probe drops until it reaches 1000m which takes about 5-10 min, then we break the copper wire and the data collection stops.

The XBT and XCTD stations are spaced so we collect data every 5-6 miles. Occasionally we have to take some water samples to measure salinity, CO2 and oxygen of the water where we launched the XBT and XCTD. All these data are collected as an ongoing collaboration with researchers from different parts of the world, who are interested in characterizing the water properties of the Drake Passage. The R/V L.M. Gould has been collecting these data every 6 weeks for the last 5-6 years.

Even though our hands get cold during these stations, the weather has been nice to us and we haven’t encountered the bad weather that is usual for the Drake Passage. We have 5-6 ft swells with wind speed of 25 knots, which makes it a little challenging to type in the laptop since occasionally you have to use one hand to hold on to the bench.

Stay tuned for more news, since tomorrow we’ll be arriving at Cape Sheriff (Livingston Island) and helping NOAA scientists on board to get settled for their 4 month long camp!

Submitted by Paola Batta-Lona – November 5, 2011

Friday, November 4, 2011

PICTURE OF THE DAY (November 4, 2011)


Cape Petrels fishing in our bow wave in the Drake Passage (Photo by Peter H. Wiebe)

DEPARTURE and CROSSING


The last days and hours before an oceanographic cruise are filled with intense activity. The LM GOULD was docked in Punta Arenas (Photos A and B), while people, personal belongings, scientific equipment and supplies, fresh food, and much more were moved aboard, stowed, and lashed down securely. We got underway at 12:00 Noon (Photo C) and headed down the Straits of Magellan to the northeast.

The first afternoon after leaving port was filled with safety briefings. All members of the science teams and the technical staff met for a review of safety procedures by the Marine Program Coordinator (MPC) and Chief Mate; we all put on life jackets and the survival suits. We then heard a briefing about the vessel life boats – and all climbed into one boat and strapped ourselves into the seats. A bit later, a lab safety briefing was given by the Marine Science Technician (MST), followed by a deck safety briefing by a Marine Technician (MT), who explained how to wear the float coats and hard hats required for work on deck. [The exceptionally hard-working and knowledgeable technical support staff employed by Raytheon Polar Services Co. (RPSC) will be introduced in a later post.]

We have crossed the Polar Front and now the SST is 1.5 degrees C. [See Photo E with sea surface temperature (SST) superimposed on the area bathymetry (depth contours).] Winds have picked up and they are now around 25 kts, but both wind and seas to our back. The ship is rolling heavily as we continue on course across the Drake Passage to Cape Sheriff, Livingston Island (Photo E). 


Submitted by Ann Bucklin – 04 November 4, 2011

Thursday, November 3, 2011

ODE TO THE SALP

While in port, a poem appeared on the white board outside the chief scientist's office. We were able to discover who left this "anonymous" masterpiece: our Raytheon Special Projects Manager, John Evans, who admitted that his inspiration had origins in a more famous poem. Do you know the original poem? Here is the "salpy" version:

MATCHING WITS WITH THE WILEY SALP

I think that I shall never see
A salp as lovely as a tree
In fact – as best I can recall –
I’ve seldom seen a salp at all!

I’ve plowed the seas from west to east,
In search of this elusive beast.
A beast of cunning, craft, and guile
With habits gross, appearance vile.

A beast of loathsomeness unmatched
When found with amphipod attached
O salp! O creature least divine!
You’re nothing but transparent slime.

And yet I seek thee all the while
Here in thy salpy domiciles
How is it that I search for thee?
What secrets might thou share with me?

And may those secrets be descried
Immersed in glutaraldehyde?
How is it that our lives entwine?
What links thy destiny with mine?

And tho’ I’ve searched for thee in vain
I have no wish to cause thee pain.
So e’re we part, I’ll simply say
Have a happy, salpy day!

By John Evans
Special Projects Coordinator
Raytheon Polar Services Co.

With apologies to a more famous poet!

Sunset in the Straits of Magellan

The view from the LM Gould this evening as we sailed eastward into the Straits of Magellan

Picture of the day, 11/02/2011, by Peter Wiebe.