Joe Warren is a professor of Marine Sciences at Stony Brook University; he is the lead investigator for a different NSF-funded project on our cruise, LMG11-10. You can follow Joe’s blog at: http://aleslab.blogspot.com/. Here are the extra-credit questions Joe has posed for his SBU Physical Oceanography students. -- Ann Bucklin
On the boat we get a couple different kinds of weather and satellite maps which we use to help us try to understand what the weather will be like during our trip. We also get a daily forecast sent to us for the general area by the Navy which is very handy and supplements the following maps.
On the boat we get a couple different kinds of weather and satellite maps which we use to help us try to understand what the weather will be like during our trip. We also get a daily forecast sent to us for the general area by the Navy which is very handy and supplements the following maps.
Ice Coverage
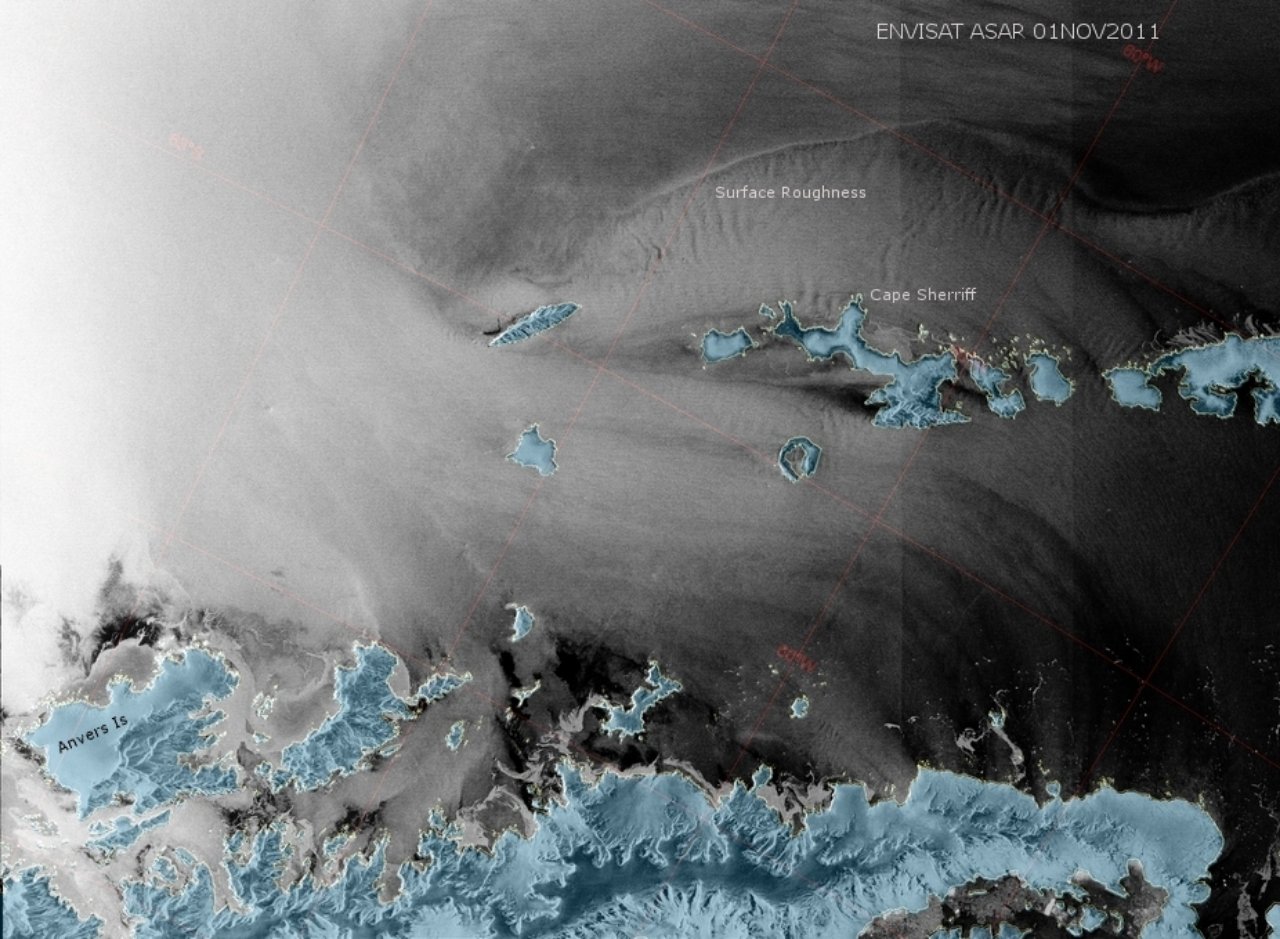 | |
| Satellite image of ice cover from 01 Nov 2011 |
Satellite maps of ice coverage are useful for us to determine how likely we will be to open the field camp and drop off the penguin and pinniped researchers. Land masses are filled in blue. Ice coverage can be seen, although in some cases it is difficult to determine ice vs. cloud cover vs. other reflectances in the images. Icebergs appear as small white dots or specks. There are many different stages of ice (brash, grease, frazil, pancake, fast, first year, second year, etc), and these images often can't distinguish these types from one another. Our last night in Punta Arenas, we ate dinner next to a group of pilots from NASA who are flying radar and other instrumentation aerial surveys of ice cover and thickness on Antarctica (mostly ice on land, not sea ice). Their instruments can measure ice thickness, heat content, or other data types that help us to understand the movement of heat in this region.
Barometric Pressure Maps
 | |||
| Combination visible satellite and barometric pressure map (green lines) for today |
 |
| The Chilean Navy's maps relay on hand drawn isobars and contours. You can see from the map, they welcome reports of current conditions to help their forecasts as there are very few weather stations in this area to provide input data into predictive models. |
Underway Meteorological Observations
 |
| The ship has monitors in most labs (and state rooms) that display the current meteorological conditions. This (as well as deck cameras) is very useful information to have when getting ready for deck work on the ship as you have some idea of what it's like outside before you actually go outside. I've blacked out the wind speed and direction information in this image, but you can look at what the current air and sea surface temperatures are right now. |
Questions for students
1. What is your prediction (based on the satellite image above) for the level and type of ice we'll encounter tomorrow when we get to the camp. We will be anchoring the boat NE of the Cape Shireff peninsula about 1.5 km from land. Provide an estimate of % of surface covered by ice and thickness (in cm) of the ice that we might find (guessing open water / no ice is also an option).
2. What would the presence of a 10 cm thick layer of ice over the surface of the water around this island mean in terms of the temperature and salinity profiles here ? That is, draw T and S vertical profiles for a spot just off of Cape Shireff (assume water depth is 200 m) for early austral spring (November) for the region with and without a layer of ice.
3. Our ship is currently located at 59.5 S and 62.5 W. Using the two above maps (and no other resources), provide a prediction of the following for today: wind direction (remember we're in the southern hemisphere) and rough guess at the speed and % cloud cover. And for tomorrow (05 Nov – noon – you can assume all times on the maps and for predictions are GMT), predict what the wind speed (qualitatively) and direction will be at Cape Shireff (roughly located at 62 S, 62 W). Provide an explanation for what your predictions are.
4. From the meteorological plot, do you think we are on the North or South side of the polar front (i.e. Antarctic Circumpolar Current) ? Provide an explanation of why you picked which side.
Answers will be posted in due time both here and on the Warren Lab home page. See http://aleslab.blogspot.com/
Posted by Joseph D. Warren (Stony Brook University)
No comments:
Post a Comment