Monday, December 5, 2011

WE ARE DONE!

On Nov. 30th, we left Palmer Station and headed for King George Island and the NOAA field camp, dubbed Copabanga, where we were able to go ashore and see dense penguin colonies (with all three species - Gentoos, Adelies, and Chinstraps - apparently co-existing), while we hauled trash and propane tanks from the field camp. With good weather holding, the LMG got underway for Punta Arenas about 12:00 Noon.

For a short while, we thought the Drake Passage would lie down for our transit. But by the afternoon of Nov 30th, it was clear that we were in for a usual Drake crossing. Winds gusted over 50 kts and we pitched and rolled our way into the wind and through 5 m swells (Fig. 1). By morning, we reached the Straits of Maire (Isla de Estados), where we were more protected from the winds and waves, and conditions improved.


Figure 1. Wind speed gusted over 50 kts (left) and wave heights were over 5 m (right) during our crossing of Drake Passage on 29-30 November 2011.

We pulled up to the dock in Punta Areanas about 10:00 AM on Dec. 1st. After the ship was cleared through Chilean customs, we were free to disembark. The science teams were allowed to stay onboard the LMG for the night, but some of us had reservations for nearby hotels (Fig. 2). In any case, everyone headed into Punta Arenas for some land-based R&R.


Figure 2 (left to right): The ship pulls up to the dock in Punta Arenas; our welcome party includes port agents and customs officials; soon the science teams are free to disembark and enjoy a sunny Spring afternoon in town. Photos Ann Bucklin

A post-cruise dinner the LMG11-10 was held that evening at Las Marmitas Restaurant (Fig. 3). Our celebratory dinner - which was also our Captain's birthday - concluded the cruise activities, which were judged overall to be both successful and enjoyable. The next day or soon thereafter, most of the scientists headed for home.


Figure 3. Everyone turned out for the LMG11-10 post-cruise dinner, which was also a birthday party for Captain Joe Abshire. Photos Peter H. Wiebe

So our Southern Ocean adventure is finished! We will keep our memories and mental images of Antarctica with us forever. We all feel that we have witnessed some of the most stunningly beautiful and unique landscapes and ocean vistas that our Earth can offer. But we are also longingly wishing for the comfort and welcome of home!


-- Ann Bucklin (University of Connecticut)

Tuesday, November 29, 2011

PALMER STATION AGAIN

We returned for our second visit to Palmer Station, arriving as planned on the morning of Nov. 26th. The port call was needed to complete the cargo operations prevented by bad weather on our last visit and also to pick up scientists and Raytheon folks who returning from Palmer to Punta Arenas with us. Most of us also used the day for a quick trek up the Palmer glacier (Fig. 1).

Figure 1. A) Palmer Station seen in better weather at our second port call. B) Paola under a signpost at Palmer, including a marker for Stonington, CT. C) View of the ship from atop Palmer Glacier. D) Glacier hikers (from left) Joe, Melissa P., Chelsea, Melissa M., Katy, Peter. Photos Peter Wiebe.
During the afternoon, the Palmer Station residents generously arranged Zodiac trips –  complete with safety briefings, emergency rations, and tour guides – to a nearby Adelie penguin rookery. We all suited up and headed off for a close-up view of Antarctic wildlife (Fig. 2).

Figure 2. A) Adelie penguin rookery near Palmer Station; a charter sailboat is in the background. B) Paola and penguins. C) Climbing over the rocks on the island are (from left) Ann, Joe, and Paola. Photos Peter Wiebe.
Our visit to the island gave us a great look at Adelie penguins up close. They have fascinating – and cute – behaviors that make simply watching them great fun. The penguins coexist happily with elephant seals, but the skua tries to drive the birds off their nests to steal their eggs (Fig. 3).

Figure 3. Adelie penguins being themselves: courtship display (A); snow bathing (B); and carrying a rock (C). D) A skua waits for an opportunity to steal eggs – but can also try to create one. E) An elephant seal keeping a watchful eye on us. Photos Peter Wiebe.
The next day, with our passengers and cargo aboard, we dropped the lines for departure. Once away from the dock, the Palmer Station residents bade farewell to their departing residents with a traditional display of affection and respect (Fig. 4). Brrrrrrrr!

Figure 4. Palmer Station residents turn out to see the LM GOULD off to Punta Arenas. A) Lines are dropped as we depart. B) Station folks gather at the dock. C and D) The traditional send-off for departing Palmer Station residents – a sign of affection and respect. Photos Peter Wiebe.
As we steamed away from Palmer Station, we were again treated to close-up views of stunning Antarctic scenery. The good weather gave us another chance to for up-close views of wildlife, including groups of crabeater seals hauled out on the ice (Fig. 5).

Figure 5. A) View of Palmer Station as the LM GOULD departs. B) Gathering on the 02 deck to view the sites, including crabeater seals hauled out on the ice. C) Paola (left) and Ann on deck for departure. Photos Peter Wiebe.
A bit later, we all headed out on deck again for a final view for this cruise of Neumayer Channel (Fig. 6). These mountains now look familiar to many of us. We will miss this vista!

Figure 6. Panoramic view of Neumayer Channel seen from the LM GOULD as we steam away and North toward Punta Arenas. Photo and photomerge by Peter Wiebe.
-- Ann Bucklin (University of Connecticut)

Monday, November 28, 2011

Picture of the Day - November 28, 2011


A Gentoo penguin porpoising over its own reflection in Flanders Bay, off Gerlache Strait, Antartica. Photo Peter H. Wiebe.

Sunday, November 27, 2011

VISIT TO “KRILL CITY” IN FLANDERS BAY

Our last stop on our Salp Survey cruise was to Flanders Bay, a protected fjord off Gerlache Strait. We couldn’t have been luckier with the weather! The morning of Nov. 25th was sunny and calm, offering a stunning landscape of snow-covered peaks and glaciers and their reflected images in the still waters (Fig. 1).

Figure 1. View with reflections in the calm waters of Flanders Bay, Western Antarctic Peninsula region.
The good weather was particularly welcome since we had planned two launch two small boats from the LM Gould: one for salp and krill collection and the other for a small-scale bioacoustic survey. Both Zodiacs followed the ship’s trail through the ice (Fig. 2) to get closer to an area that Joe Warren had studied last year and dubbed “Krill City”. One zodiac was equipped for a small-scale bioacoustical survey of zooplankton distributions.

Figure 2. Left: The LM Gould clearing a path through the ice in Flanders Bay for the small boat operations. Right: Joe Warren standing in a zodiac equipped for small-scale bioacoustical surveys of zooplankton distribution and abundance.
The second zodiac was launched with a team to collect salps and krill. Our scientific pursuits did not at all interfere with the fund and adventure of being on the water in a stunning landscape of snow and ice and sparkling clear water (Fig. 3).

Figure 3. Small boat operations in Flanders Bay. A) The acoustics survey team included Kelley Watson (MT and Zodiac driver) and Katy Wurtzell. B) The salp- and krill-collecting team included MST Melissa Paddock (left) and MT Krista Tyburski (B) and Paola Batta-Lona (C). D) Krista at the helm.
As we navigated around bergy-bits and ice-flows, we came across wildlife that seems unconcerned by such strange orange beings (the float coats are required for on-the-water work, so everyone is very similarly attired). We heard a minke whale come up for air and were surrounded by penguins who kept a watchful eye of us, but stood their ground (Fig 4).

Figure 4. Gentoo penguins were everywhere in the Bay. They hung out on the ice and stood up to keep an eye on us.We also saw them porpoising through the water, including one who followed our zodiac for several minutes.
We also found at least some of what we were looking for. In Krill City, we collected the tiny larval (immature) krill that swarm under the ice bits (Fig. 5). These are the floating krill nurseries that contribute to the krill dense swarms of the Western Antarctic Peninsula region. The tiny krill feed on algae growing on the under-surface of the ice. We are particularly interested in the genetic make-up of these krill, which are a different generation from the juveniles and adults we have collected in other regions during our cruise.

Figure 5. Paola collecting larval krill from a floating “krill nursery” under a bit of ice.
The day in Flanders Bay was both thoroughly enjoyable and scientifically successful. For many of us, it was our favorite day of the cruise! It was also the last day of work for us. Later that night, we finished up our Salp Survey with a complete series of CTD cast, MOCNESS tow, and IKMT tow at the mouth of Flanders Bay. Then the technical team started breaking down our sampling gear and we steamed for our second port call at Palmer Station.


-- Ann Bucklin (University of Connecticut)
   All photos: Ann Bucklin

Friday, November 25, 2011

Picture of the Day - November 25, 2011


The sun sets over an Antarctic seascape of ice and calm waters off the Western Antarctic Peninsula. Photo: Ann Bucklin

Thursday, November 24, 2011

MY FAVORITE ZOOPLANKTON

Oceanographers are just like any other sort of people – they defy any categorization. Some of us are explorers, wishing to visit the farthest, deepest, remotest, or most challenging places on the Earth. Some of us are motivated by the technological challenges of understanding life in a medium into which we cannot see, requiring us to analyze or infer or extrapolate or interpolate or synthesize – or all of these – from bits of data to an integrated view. There are probably as many reasons folks do what they do as there are people who call themselves oceanographers!

One reason that I became a biological oceanographer is my (rather unscientific) appreciation for the animals that are the focus of my research. As a group, invertebrates (animals without backbones) range from absolutely lovely to really ugly to truly scary! I fell in love with marine invertebrates while I was a student at Oberlin College. I took a course in Marine Biology – a somewhat unlikely bet for “my favorite college course” in the fields of Ohio. The instructor was Dr. David Egloff, who somehow made the formalin-preserved, colorless, and looooong-dead animals we studied under our microscopes come alive. I came to appreciate the diversity of form driven by the many different ways that marine animals “solved” the challenges of life: feeding, swimming, floating, finding mates, reproducing, escaping predators, and so on.

Quite a few years later, I still feel pretty much the same way about marine invertebrates and especially about many zooplankton (animals that spend their entire lives drifting with ocean currents). I think most zooplankton are pretty cool and many are absolutely fascinating to watch while they are alive – one of the big benefits of going to sea. I wondered whether other members of our science teams on this cruise felt the same way.  So I asked them: “Do you have a favorite zooplankton?” Here is what they said.

The salp Salpa cyllindrica showing its transparent complexity. Photo L.P. Madin (WHOI)
Paola Batta-Lona (Graduate Student in Marine Sciences, University of Connecticut)

Salps are my favorite zooplankton because they are transparent and simple-looking, but in fact – when you look at them closer or under the microscope – you realize they have interesting features. They share some characteristics with chordates like us. Salps also have an interesting and complex life cycle that involves sexual and asexual reproduction. This group of zooplankton is thought to play a major role in carbon export to the bottom of the ocean. There is some evidence indicating that salps are replacing key species like krill in the Southern Ocean. I find salps very interesting, and I look forward to find out more about them.

Jullie Jackson (Marine Projects Coordinator, Raytheon Polar Services Company)

Yes, so I have thought about this a bit and I think I am going to have to go for heteropods. Mostly because I think they look a little bit like Snuffalufagus

Melissa Paddock (Marine Science Technician, Raytheon Polar Services Company)

OK, here ya go, my favorite zooplankton is Clione limacina because how many times have you seen a flying snail underwater? They should have replaced the synchronized swimming hippos in Disney's Fantasia, because they are much more graceful, yet just as oddly shaped!

Left: The pelagic gastropod (heteropod) Cuvierina columnella seems to fly with wings. Right: The pelagic gastropod (pteropod) Clione limacina, a “flying snail”. Photos R.R. Hopcroft (Univ. Alaska)
Melissa Patrician (Graduate Student in Marine Science, Stony Brook University)

My favorite zooplankter is the copepod. I originally became interested in copepods because they are right whale food; but after studying them for several years, I began to appreciate them in their own right.  I think the adaptation to over-winter by diapausing (which is basically like hibernation in bears) is fascinating and I'm also completely amazed by how quickly and how far they can move in short bursts for their body size.

Copepods are among the most abundant and diverse of zooplankton. These two copepods, a Euchaetidae (left) and Sapphirina metallina (right) show the diversity of form. Photos R.R. Hopcroft (Univ. Alaska)
Scott Davis (Chief Mate, LM GOULD)

I like the way the polychaete worms wiggle their waggle.

Chelsea Stanley (Fisheries Acoustics, Department of Fisheries and Oceans, Canada)

My favorite zooplankton are larval octopi. I think they are beautiful and find the challenges in identifying them, which is based on the number and placement of chromatophores on the body, very interesting.
A pelagic larva (immature form) of Octopus defillipi with a rather ghostly look. Photo C. Clarke (Univ. Alaska); Right: The polychaete worm Tomopteris swims with a wave of wiggling modified legs or parapodia. Photo R.R. Hopcroft (Univ. Alaska)
Swimming bells of the siphonophore Diphyes antarctica. Photo Ryan Driscoll (AMLR, SWFSC, NOAA)
Joe Warren (Professor of Marine Science at Stony Brook University)

My favorite zooplankton is Diphyes antarctica.  It's a siphonophore (need I say more?) These creatures are a colonial organism which means nobody really knows whether it's a single animal or a group of many animals working together in a coherent unit. The photo shows the bracht or nectophore (sometimes called the swimming bell) of the animal. Not shown are the tentacular appendages which it uses for feeding, as these are almost always destroyed by net sampling.


Katie Wurtzell (Research Technician, Gulf of Maine Research Institute)

Fish eggs caught on this cruise with the little fish very much alive in the egg casings. Photo Melissa Patrician
My favorite zooplankton we have found this cruise would have to be the fish eggs.  They don't look like much in the bucket, but when you take them inside and look under the microscope - they're beautiful. They have bright blue eyes and pretty geometric markings on their bodies. They are also moving inside the egg, opening and closing their gills.  You can tell they are on their way to being a full grown fish!

Ann Bucklin (Professor of Marine Sciences, University of Connecticut)

Images of living zooplankton in a poster for the Census of Marine Zooplankton (CMarZ; see www.cmarz.org)
I have the unfair advantage of answering my own question last. So I will punt and reply that I reply that I like all marine zooplankton best! One reason is that I was one of the lead scientists for a global study of marine zooplankton diversity, called the Census of Marine Zooplankton (CMarZ). We made a poster with some of the images of living zooplankton from the CMarZ project (and some of them are shown above too). These are a small sampling of the 7,000 described species of 16 different phyla that live in the pelagic realm of the world oceans. I hope you will take a look at the photo galleries of living zooplankton on the CMarZ website (see http://www.cmarz.org). 

-- Ann Bucklin (University of Connecticut)

P.S. I once asked my Oberlin College instructor, David Egloff, if I might do anything to express my gratitude to him for being a wonderful teacher and introducing me to marine invertebrates. He said, “Why don’t you give me a warm acknowledgment in one of your papers?” Just in case you are checking the blogosphere, Mr. Egloff, here’s another ‘warm acknowledgment!’

Wednesday, November 23, 2011

During our cruise, we sampled along Bransfield Strait as part of the survey for salps and krill. We entered the strait from the east by coming around Elephant and Clarence Islands after a series of stations along the Drake Passage north of the South Shetland Islands. The MOCNESS was towed obliquely to 1,000 meters at our Stns #14, #15, #17, #19, and #20 (Fig. 1).

Figure 1.Map of the stations in Bransfield Strait from which the temperature and salinity data were mapped.  The Strait lies between the Western Antartic Peninsula and the South Shetland Islands. Stations are indicated by number; islands are indicated by letter and named at right.
During each MOCNESS tow, data were collected on pressure (P), the temperature (T), and salinity (S). The data were used to create a longitudinal view of the physical oceanography of the Strait, called a hydrographic section, from the surface to 1,000 m. The pressure, temperature, and salinity values from both the down- and up-haul of the MOCNESS were assigned geospatial (latitude and longitude) coordinates. The values were then mapped in relation to Stn #14, which was at the northern end of our section (Fig. 2).

Figure 2. A) Temperature and B) salinity sections for Bransfield Strait. Distance from Stn #14 is shown on the x-axis; tracks of the MOCNESS are shown as white vertical lines; the values were interpolated to provide the views shown using EasyKrig3.0 (Chu, 2004 and ftp://globec.whoi.edu/pub/software/kriging/easy_krig).
Although the number of profiles was small and the spacing wide, the T and S sections provide a basis for comparison with previous studies of the physical oceanography of Bransfield Strait.
Relatively warm deep (above O C) water from the offshore Antarctic Circumpolar Current enters the southern portion of the Bransfield Strait through a channel between Snow and Smith Islands. This water, which flows past Low Island and into the Strait between Deception and Trinity Islands, is identified by being warmer than 0o C and with a salinity of about 34.5 PSU. Such water is evident at Stn #20, which was situated between Low, Trinity, and Deception Islands.

According to Stern and Heywood (1994), “Deep basins within the Strait contain only Bottom Water, which is colder and more saline than the Antarctic Bottom Water of the Drake Passage and the Scotia Sea, and which is formed in situ during the seasonal freeze of Surface Water.” This water, known as the Bransfield Strait Basin Bottom Water, is also evident in our sections as the less than -1.0o C water in the center of the section at Stns #17 and #19 below about 400 m (see the dark blue area in Figure 2A).  The cold (~ -0.5o C) less saline water at the surface is likely from Weddell Sea to the east of the Strait.

This type of analysis of the physical oceanography of the Southern Ocean regions we are sampling will be used to help us understand the ecology of the zooplankton we collect. In particular, the different origins of the water in the Bransfield Strait will have a strong influence on the distribution of the target species, salps and krill, that we are studying. 

-- Peter Wiebe, Woods Hole Oceanographic Institution

Reference:
Stern, M. and R.B. Heywood (1994) Antarctic environment - physical oceanography: the Antarctic Peninsula and Southwest Atlantic region of the Southern Ocean. In Southern Ocean Ecology: the BIOMASS Perspective, [Ed] S. Z. El-Sayed, Cambridge University Press, New York. Pages 11-24

Tuesday, November 22, 2011


Livingston Island, Antarctica, viewed from the LM Gould (November 20, 2011).
Photo Peter H. Wiebe

WHAT’S IN SEAWATER?

Figure 1. Deploying the CTD and Niskin bottles in order to study what exactly is in this seawater the ship is sailing through.
“What’s in seawater?” I asked some folks in the lounge this evening (while watching our 3rd episode of the television series “Weeds” – I’m TOTALLY hooked!)The answers I got ranged from “dinosaur pee” and ”the world’s toilet” to ”pollution from our ship” and ”whale poo.” It has become apparent to me that perhaps it is time to have a quick lesson in what exactly IS in seawater and why are we out here studying it.

One aspect of the water we are interested in is its physical properties (such as its temperature, salinity and density). We study these properties with an instrument called a CTD (Conductivity Temperature Depth sensor). Both temperature and salinity (i.e. the salt content of the water) affect the water’s density. In most parts of the world’s ocean, temperature is the most important factor controlling the density of the water. However, the Southern Ocean is different. Here, the temperature doesn’t change much…its cold…often. The salinity, however, changes much more because of the melting of the seasonal sea ice. Therefore, the changes in how much freshwater is melting into the ocean from the ice change the density of the water here much more than the small seasonal changes in temperature.

Another thing we study when looking at the water is its biological and chemical properties. In order to do this, we collect water from bottles (called Niskin bottles, named after Shale Niskin, who patented the bottle design in
Figure 2. A look at the vertical profile of the water column at one of our stations. This information is being sent live over a data wire from the CTD, so we can see in real time what the water looks like!
1966) located around the CTD; we shut these bottles at various depths to collect water from the bottom of the ocean all the way to the surface. We then filter this water to look at these properties. The Warren lab is filtering water for chlorophyll. This is a pigment found in the phytoplankton (the ‘plant plankton’ of the ocean). By measuring the amount of chlorophyll, we can look at approximately how much phytoplankton (i.e. salp and krill food) is in the water. This is a useful piece of information for us!

Both the Warren and Bucklin science teams on our cruise are filtering water for clues about the environment here. I’ll hand this over now to Paola to talk about what her group is interested in finding out about the seawater.

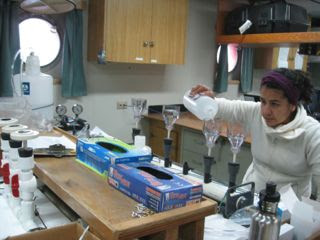
Figure 3. Paola and Chelsea pause for a photo while collecting water from the Niskin bottles around the CTD. They will bring this water inside and filter it to look at the seawater’s various biological and chemical properties.
-- Melissa Patrician (Stony Brook University)


In our hunt for salps, we are trying to understand their distribution patterns and the chemistry of the ocean holds lots of clues as to where we might find these gelatinous critters! The Bucklin lab is looking at both the nutrients and particulates in the seawater.

In the area of Antarctic waters where we are working, concentrations of nutrients (nitrate and phosphate) are much higher than those found in other oceanic waters. They tend to be lowest at the surface and greatest in the warm deep waters.

Particulates, alternatively referred to as particulate organic matter (POM), are tiny particles of solid material present in the water column. Particulates within the water column come in a multiplicity of sizes and from a great variety of sources: dead phytoplankton cells, fragments from attached macroalgae, dead bacteria, dead protozoa, dead micro- and macro-zooplankton, crustacean exuvia, and fecal pellets, especially those from copepods, euphausiids, and salps.

Figure 4. Paola concentrating on filtering the seawater for nutrients and particulates.
Salps are indiscriminate filter feeders, utilizing an internal mucus net to capture particles as water is pumped through the body. Therefore, they are assumed to ingest all particulate matter (both living and dead) small enough to fit through their oral opening and large enough to be retained by the mucus net. This may include particles as small as 1 to 2 microm.

So, if we want to look at the big picture and understand the behavior or occurrence of salps in the Southern Ocean, the characterization of the chlorophyll by the Warren team will help with understanding the prey (phytoplankton) distribution. The Bucklin side of the analysis will help with understanding under what nutrient and particulate concentrations we tend to find salps more frequently.

Well, that’s it for today’s lesson: “What’s in Seawater?” Hope you learned something!

-- Paola Batta-Lona (University of Connecticut)

Monday, November 21, 2011

Picture of the Day - November 21, 2011


Cape Petrels ride the waves in Bransfield Strait, Antarctica.
Photo Peter H. Wiebe

THREE WEEKS LATER

We have now completed work at 13 stations (Fig.1) and completed 14 CTD casts, 15 MOCNESS tows, and 14 IKMT tows. We are on track – in terms of progress through our cruise plan – to complete work at nearly all of our planned stations. At this writing, we are heading back into the open waters of Drake Passage with the goal of working at four deep-water locations (Stns #6, #5, #4, and #24), two shelf stations (#23 and #3), and a station in protected waters of Gerlache Strait.
Figure 1. Station locations for LMG11-10. As of 20 Nov 2011, work has been completed at stations shown with circled station numbers.  The cruise track and order of stations were changed to accommodate weather. The star shows the ship’s location at 8:00 pm on Nov. 20th.
Our cruise has already been very successful. Our samples from vertically-stratified MOCNESS tows at each station are yielding a useful view of the pelagic community of the Drake Passage and Bransfield Strait.  Taxonomic analysis of these quantitative samples will help us characterize the early spring assemblage of the Western Antarctic Peninsula region.  We will compare our findings with an earlier study, the comprehensive US GLOBEC Southern Ocean Program carried out during Fall and Winter, 2001 and 2002. Peter Wiebe led four US GLOBEC cruises as chief scientist; he collected zooplankton samples using a MOCNESS just like the one we are using now and equipped with strobe lights to reduce net avoidance by krill.

Our nets have brought up huge catches of krill, usually in surface nets sampling during the dark, have contrasted with generally sparse MOCNESS and IKMT samples. We have caught only a small number of salps.  Our team has processed 65 aggregates and 10 solitaries – some of them exceptionally large and packed with embryos, which can quickly generate a population “bloom” of chain-forming aggregates.  Other specimens collected, identified, and flash-frozen for genomic and transcriptomic analysis  (please look up the definitions of those terms yourself) include ~300 individuals of Euphausia superba (including larval, juvenile, and adult stages), with the telson (tail) preserved separately in alcohol, so individuals can used for analysis of cohort (life stage) structure.  We have also flash-frozen various zooplankton that caught our interest, including copepods, gastropods, ctenophores, and amphipods, among others.

Our goal is to obtain material for genomic and transcriptomic analysis, especially for the Southern Ocean salp. The best source of material for these analyses is from our IKMT tows, which are shallower and usually yield living zooplankton. These specimens are identified and flash-frozen for analysis at UConn.

Why so few salps this year?  In December 2004, salp researchers caught tens of thousands of salps, which they caught live by SCUBA diving!  In December 2010, hundreds of salps were caught at many of the same locations we are visiting this year.  We speculate that the Spring population increase of salps may be delayed this year.  Several knowledgable people have remarked on the late ice cover this year of coastal waters of the Western Antarctic Peninsula region.

So our salp hunt continues, and we are looking forward to seeing what the open shelf and offshore waters may hold. 

-- Ann Bucklin, University of Connecticut

Saturday, November 19, 2011

PLAYING THE WAITING GAME IN THE ANTARCTIC SPRING

The Drake Passage, the narrow passage that extends from the tip of South America to the tip of the Western Antarctic Peninsula is well known for treacherous sea conditions. Many sailing ship’s of past centuries ended their careers while sailing around “the Horn” (Patagonia) and into the Drake. The past 24 hours has seen the kind of wind and seas for a sustained period of time that must have caused sailors grave concern. It has certainly cost us valuable “ship time” (the number of cruise days alloted to our project by the NSF). We have been standing by near our Stn #19, which is at the western end of Bransfield Strait, waiting for weather and sea conditions to moderate to a level where we can carry out our planned work. Similar to most stations, we want to do a series of observations and sample collections: CTD cast to 1000 m, MOCNESS tow to a 1000 m, IKMT to shallower depths, and an acoustic “Towfish” as we steam toward the next station (see ours blog s for Nov. 10th, 17th, and 18th).

Figure 1. Wind speeds between 30 – 50 kts, barometric pressure dropping, and other weather data shown on the ship’s DAS (Data Acquisition System) screen for the previous 24 hrs from 11:00 am (1300 GMT) Nov. 19th.

For the past 24 hours, we have had sustained winds between 30 and 50 kts out of the East (Fig. 1). The barometric pressure had been up around 1004 mb 2 days ago, when we had flat seas, clear skies, and excellent working conditions. It had dropped to 969.2 mb by this morning and seems to be bottoming out. This may be the longest stretch of high winds and seas we have had this cruise. 

In planning our cruise, selecting our station locations, and laying out the cruise track, we assumed Bransfield Strait would be protected from the prevailing winds, which are usually out of the N-NW. We expected the early Austral Spring would be stormy, but we did expect that stations in the lee of the islands would be workable despite high winds because of the short fetch (distance the wind blows across the water to whip up the waves).  Instead, there is an intense low pressure to our North, and the winds are coming from the East and blowing directly down the Strait. The long fetch has built the large swells that we are experiencing now.

So where did this severe weather originate? The isobar images that we get daily on the ship provide an answer. The low that settled in over the Drake Passage formed as a relatively weak low in the South Pacific Ocean off the west coast of South America on Nov 15th. It began moving SE towards the Drake Passage on Nov. 16th (Fig. 2A). The system intensified while still West of the southern tip of South America on Nov. 17th (Fig. 2B); it moved into the Drake Passage and pushed our good weather off to the East during Nov. 18th (Fig. 2C). The latest image shows the low pressure intensified, with barometer reading of 976 mb at the center (Fig. 2D).
Figure 2. Isobar images of the pressure fields around the Antarctic Continent for: A) 16 November, B) 17 November, C) 18 November, and D) 19 November 2011. The small yellow dot marks the position of our Stn #19 at the western end of Bransfield Strait; the low pressure system that is causing our high winds and seas is marked by the arrow.
The current pressure isobar image underestimates the intensity of the low, since at the ship we had a minimum barometer reading of 969 mb. With the barometer beginning to rise and from the wind chart (Fig. 3), which has light winds forecast for later today and tomorrow, work here at this station may resume in another 6 to 12 hours.
Figure 3. Forecast wind speeds and directions for the period 19-20 November 2011. Our area (Stn 19 is marked by the yellow dot) is forecast to have light winds for the next 24 hours or so.  Note the red LMG dot on the chart is an old LMG position.  
And so we will continue to stand by at our Stn #19. Work in Antarctic waters adds new meaning to the phrase: “Hurry up and wait!”

-- Peter Wiebe, Woods Hole Oceanographic Institution

Friday, November 18, 2011

Picture of the Day - November 18, 2011


View from Bransfield Strait during a lovely Spring day in Antarctica.
(Photo by Peter H. Wiebe, 17 November 2011)

USING SOUND TO SEE INTO THE OCEAN

Land creatures – including us - are used to using our vision to detect the world around us. Ecologists walking in forests, meadows, grasslands, or deserts can immediately pick out the patterns of the life forms inhabiting the space and easily design sampling protocols to see the relationships to each other and their environment. Not so in the ocean environment. As we stand on the deck of a ship peering into the darkness of the sea surface, we can rarely visualize the animals and plants living just below the surface – much less those living in the depths of the ocean. Divers swimming in the shallow reaches of the ocean have limited visibility (only a few meters in coastal regions, up to 20-30 meters in very clear water), because seawater is a very poor medium for transmitting visible light.  Light is absorbed, scattered, and reflected more in seawater than in air by orders of magnitude.  This limitation affects even the remotely operated and autonomous vehicles with cameras and video systems that can roam the ocean depths, although this technology has given us images of the organisms living deep in the ocean and are leading to new insights about their spatial patterns and behavior on small spatial scales. So how is it possible to view the fascinating 3-dimensional ocean habitat and visualize the spatial arrangement and behaviors of marine organisms on larger spatial and temporal scales?

The transmission of sound at low and moderately high frequencies (1 Hz to 100 kHz) is much more efficient in the ocean than in air. Above 100 kHz, sound is more rapidly attenuated, largely because of absorption due to the salt (principally magnesium sulfate) in seawater.  Despite this limitation, high-frequency sound in the 38 kHz to 500 kHz range is proving exceedingly useful for studies of zooplankton (our target organisms), because it can be used to detect the presence of animals 10's to 100's of meters away from the transducer producing the sound.

Figure 1. Echograms of 38 and 150 kHz acoustic data (Nov. 18, 2011). The vertical axis is depth (m); the horizontal axis is time. Intensity is shown by color (see color bar). The intense scattering shown on both echograms is probably krill patches. Image J.D. Warren
On this cruise, there are several acoustic systems being deployed to provide information about the distribution of zooplankton and larger organisms (such as fish) in the water column. The ship has a hull-mounted Acoustic Doppler Current Profiler (ADCP) with 38 and 150 kHz transducers, which is principally used for measuring current speed and direction with depth under the ship. This system depends on organisms in the water column to reflect sound and produce backscattering (i.e., the portion of the transmitted sound that is reflected off organisms back to the transducer receiver). This can be interpreted as current flow from Doppler shifts (i.e., shifts in the frequency of sound emitted by the transduers) in the returning echoes. Also recorded is the intensity of the sound returned as echoes off the organisms. As the ship steams along, the ADCP provides echograms of the backscattering intensity at two frequencies (Figure 1), providing a continuous indication of high and low concentrations of organisms below the surface.

Figure 2. A) The BioSonics towfish equipped with 38 and 120 kHz transducers being launched from the LM Gould (15 November 2011).  B)The echogram display of the BioSonics frequencies. Photo and Image P.H. Wiebe
A second system is a dual frequency BioSonics echosounder with 38 and 120 kHz transducers mounted in a towed body (Figure 2). This system is being towed off the starboard quarter of the ship for two hours at the end of a station while heading for the next station when sea conditions are good.

Figure 3. A) Joe Warren and MPC Jullie Jackson discuss the zodiac setup; note the orange transducer module on the end of the stainless steel square tubing next to the engine – it will be moved to a down position underwater during the survey. B) The Zodiac is launched. C)  Joe Warren climbs down into the zodiac. D) Kelley Watson, Krista Tyburski, and Joe Warren during a small-boat survey. Photos P.H. Wiebe
The third system is a Simrad echosounder that is battery powered and has transducers operating at 38 and 200 kHz.  It is being used from a Zodiac small boat (Figure 3) to conduct surveys of krill distribution over small spatial scales in areas of interest, where our large vessel is unable to go due to water depth. At our Stn #16, all three echosounders were operated for the first time during this cruise. Conditions were ideal, with low winds and seas – except for a long-period swell running through the survey area.

To help interpret the acoustics data, the small boat survey was conducted along the towing path of the MOCNESS, which provided depth-specific collections of animals and environmental measurements (especially temperature and salinity) in the water column at the station.  The combination of the MOCNESS and IKMT zooplankton samples and the acoustic data will provide a comprehensive picture of the vertical and horizontal distribution of zooplankton living in this Antarctic ecosystem and will allow evaluation of their status in the face of the rapid environmental changes now taking place here.

-- Peter H. Wiebe (Woods Hole Oceanographic Institution) and Joseph D. Warren (Stony Brook University)

P.S. This is Ann Bucklin with a postscript for today’s blog. Bioacoustics is an aesthetically-pleasing (echograms in deep shades of blue and red) and computationally-challenging (huuuuuge data files) field.  The simplicity of the underlying concept – bouncing sound off bugs – is captured in slogans used on Peter and Joe’s T-shirts: “We only measure voltage and time”.  It is also apparent in Peter’s haiku poetry on the subject, including this one:

Echoes

A loud ping goes out
A whisper echo returns
From deep-sea creatures

-- Peter Wiebe


Thursday, November 17, 2011

Picture of the Day - November 17, 2011


WHAT DID WE DO TODAY?

What a difference a day makes!  Our weather was absolutely tropical today. We have been working at our Station #16 throughout the day. We are protected by surrounding islands in relatively shallow water (about 500 m). We have had the luxury of working steadily throughout the day, without the down-town necessitated by waiting for workable weather.

So what did we do today? We collected zooplankton in IKMT and MOCNESS tows, and then worked quickly to observe and measure the living organisms and also prepare, process, and preserve samples. Here is a sampling of our work on board the LM GOULD.


A) When the MOCNESS is recovered after a tow, 3 or 4 people – including scientists and technicians – are needed on deck to wash down the nets while they hang of the stern gate, and then lift the cod ends over the gate, where they are detached from the net.

B) Each of the nine cod ends is brought into an “aquarium room” with running sea water, where the zooplankton sample can be processed. Paola is using a seawater hose to wash the cod end after the sample is removed.

C) The catch from one net: we have been sampling dense swarms of Southern Ocean krill in the surface layers (above 50 m), especially during the night. The bright red color is characteristic of krill; if you look closely you can see that their guts look greenish – they have been grazing on phytoplankton. For more about other zooplankton we have caught, see Melissa Patrician’s blog for today at http://aleslab.blogspot.com/.  Be warned, it’s a quiz!

D) Each step in the processing of samples is recorded, with separate logsheets for each procedure or analysis. We keep track of all the collection information (called “metadata”) for each sample. Here Melissa M. is keeping track of specimens removed from the samples.


E) The sample is pourted from the cod end into a device that divides the sample into equal halves, so they can be shared between the science teams and preserved for different types of analyses. Joe is holding the “box splitter”, while Paola pours out the sample.

F) The box splitter is rocked back and forth to separate the sample into two chambers, which can be poured off separately. Joe is splitting the net sample.

G) Each half of the sample is washed into a sieve to remove the sea water. The zooplankton can then be washed into a plastic sample jar.  Paola demonstrates our sieving technique, with a seawater wash bottle.


H) One half of the sample is preserved in formalin for later identification of species and determination of their abundance or concentration in the volume of water sampled by each net. Melissa preserves samples in buffered formalin, working in a fume hood in the ship’s hydrolab.

I) Living specimens of species of interest – including salps, krill, jellyfish, comb jellies, chaetognaths, amphipods, and many other species of diverse animal groups – are removed from the samples for special analysis. Ann is measuring individual alive-and-kicking krill inside the “freezer van” on the LM GOULD, before flash-freezing them in liquid nitrogen for genetic analysis.

J) The specific gravity of specimens of a variety of zooplankton groups is being measured by Joe Warren’s team. Katie is setting up the experiment in a ship’s “cold van”. For more explanation about this study, see Joe Warren’s blog for November 14th at http://aleslab.blogspot.com/.

We can only hope for more lovely work days like today, but the weather forecast suggests that the Southern Ocean may have something else in store for us. Here we go again!

-- Ann Bucklin (University of Connecticut)

Wednesday, November 16, 2011

WHY ARE WE HERE?

Figure 1. Changes in krill and salp densities over time: a) Krill density in the SW Atlantic sector; b) post-1976 krill density in scientific trawls; c) 1926–2003 circumpolar salp data. Figures from Atkinson et al. (2004)
We might ask ourselves this question on a day like today, when the winds have sprung back up, whipped up the waves, thrown ice bergs in our path, caused the ship to pitch and roll ceaselessly, and stopped us from carrying out the sampling we had planned for today. But in fact, this question – in a larger context – is important to many of us who have spent much of our lives studying the ocean, especially the Southern Ocean. 

We are here in the Western Antarctic Peninsula (WAP) region of the Southern Ocean because it is a bell-weather region for climate change and global warming. A 2004 paper by Angus Atkinson and others summed it up well:  

“The western Antarctic Peninsula is one of the world’s fastest warming areas, and (atypically for the Southern Ocean) winter sea ice duration in this sector is shortening. Key spawning and nursery areas of krill are thus located in a region that is sensitive to environmental change. Deep ocean temperatures have increased, and a circumpolar, pre-1970s decrease in sea ice has been indicated at several locations. The regional decrease in a high-latitude species with high food requirements (krill) coincides with an increase in a lower-latitude group with lower food requirements (salps). However, as the mechanisms underlying these changes are uncertain, future predictions must be cautious. These changes among key species have profound implications for the Southern Ocean food web. Penguins, albatrosses, seals and whales have wide foraging ranges but are prone to krill shortage.”

Figure 2. Southern Ocean food web. Image British Antarctic Survey
The vulnerability to climate change of the Southern Ocean pelagic ecosystem – and the special
Figure 3. Top: The Southern Ocean krill, Euphausia superba (Photo Uwe Kils). Center and bottom: The Southern Ocean salp, Salpa thompsoni, solitary and aggregate forms (Photos Larry Madin, WHOI)
vulnerability of krill - is of deep concern to oceanographers and climate scientists. Krill are a keystone species for this ecosystem, meaning they are pivotal to the nexus of relationships among species that live here and are connected in a “who-eats-who” framework, known as a food web. The Southern Ocean food is pretty simple compared to many other ocean regions. There are fewer species and fewer trophic steps to the top predators or “charismatic megafauna” (seals, whales and porpoises) that many people know and love best. This cruise is focused on salps and krill, and our goal is to help ensure that many people know and love these creatures best – or at least as much – too. To help make our case, here are the major protagonists of our story, alive and well and looking their charismatic best (Fig. 3).


-- Ann Bucklin (University of Connecticut)


Citation for quotation:

Angus Atkinson, Volker Siegel, Evgeny Pakhomov & Peter Rothery (2004) Long-term decline in krill stock and increase in salps within the Southern Ocean. Nature 432: 100-103

Tuesday, November 15, 2011

Picture of the Day - November 15, 2011

Early morning sun shines on the ice cliffs of Clarence Island, Antarctica.
Photo Paola G. Batta-Lona

EUREKA – WE CAUGHT A SALP!

The Southern Ocean pelagic ecosystem is known to be highly variable among different Antarctic regions and to show dramatic variation among both seasons and years. This year, many people have commented on the unusual amounts of remaining ice. Perhaps Austral Spring is late this year. Our studies will help analyze this variation in species composition and abundance over time and space. Prof. Joe Warren (Stony Brook University) and his students – carrying out another salp project on our cruise – are measuring “biovolume” of our plankton catches. At SBU, other students will determine the abundance of different zooplankton species in the preserved samples. These data will be compared with results from other Southern Ocean regions and years.

Figure 1. Living Southern Ocean krill soon after capture.
Our zooplankton catches have been rather smaller than we expected. – but with many different species. Important for our study, we have sampled dense patches of juvenile and adult Southern Ocean krill (Euphausia superba; Fig. 1). Krill are a keystone species for the pelagic ecosystem here and dominate the zooplankton assemblage in biomass and abundance. They are an important species for us too, since they are important player in the dynamic balance between salps and krill in the Southern Ocean food web. Our goal is to understand the population dynamics of both species in relation to the zooplankton community and environmental conditions in the Southern Ocean.
Figure 2. Station locations for the Salp Survey cruise, including sites in the Drake Passage (Stns 4-11) and Bransfield Strait (Stns 14-21). We have completed work at stations with red numbers.
Back to our unfolding oceanographic adventure! Yesterday the winds blew at 30 – 40 kts as we steamed SE in the Drake Passage from our Stn 11 (Fig. 2), where we had completed work in a patch of good weather amidst days of howling winds and high seas. We arrived at Stn 12 during the morning, but the seas were still up and swells were coming from two directions. We waited until conditions calmed down and went to work in the early evening.

Figure 3. Fifteen seconds of fame for the first salp caught on our cruise! With the star is its biggest fan, UConn PhD student Paola Batta-Lona. Photo Ann Bucklin
Eureka! We caught our first salp in Net 4 (which sampled from 200 – 100 m) in our fifth MOCNESS tow of the cruise. We preserved the salp separately to give it some special attention (Fig 3). We hope to find many many many more salps! And we may catch a bit of luck with weather, with forecasts for winds between 15 and 20 kts for the next 24 - 48 hrs in our area. That should give us time to sample our northern-most stations and head back south through Bransfield Strait, where we should find some protection from the westerly winds. Salps, Ho!

-- Ann Bucklin (University of Connecticut)